Most would agree that there is no definitive right answer to the question, “How do you measure UX?” As it is true for most aspects of experience design, the answer depends on several factors. The use context, how UX is perceived, and database-level readiness are some of the factors the keep the answer to such a question constantly evolving. This article will explore the depth of these answers.
When an experience takes place, time elapses, and some effort is made, which includes all kinds of possible ways of interacting with different interface elements. So if all that is happening, one of the simplest answers to the question above is that yes, UX can be measured in those experiential dimensions.
We know quite well that there are existing and evolving metrics that help us measure UX — ever wondered how can we accurately define a UX metric?
The core idea behind a UX metric is that it always reveals something about the interaction between the user and the app, product, or service.
Metric helps us uncover one or more of the following aspects of user interaction:
- The element of being able to complete a task (“effectiveness”)
- Amount of effort required to complete a task (“efficiency”)
- The degree to which a user is happy with his/her experience while performing a task (“satisfaction”)
As well as some other aspects like desirability (i.e., does the experience leave him/her with the desire to come back and so on?) These are some aspects that constitute the idea of experience measurement.
At times, it could be daunting to classify ever-evolving metrics. Following four categories ( under which most UX metrics could fall ) can be easily understood:
- Measures — Are easily quantifiable
- Self-reported — Reported by the user him/herself
- Categorical (Events based)- Qualitative aspects of experience
- Emotion-linked
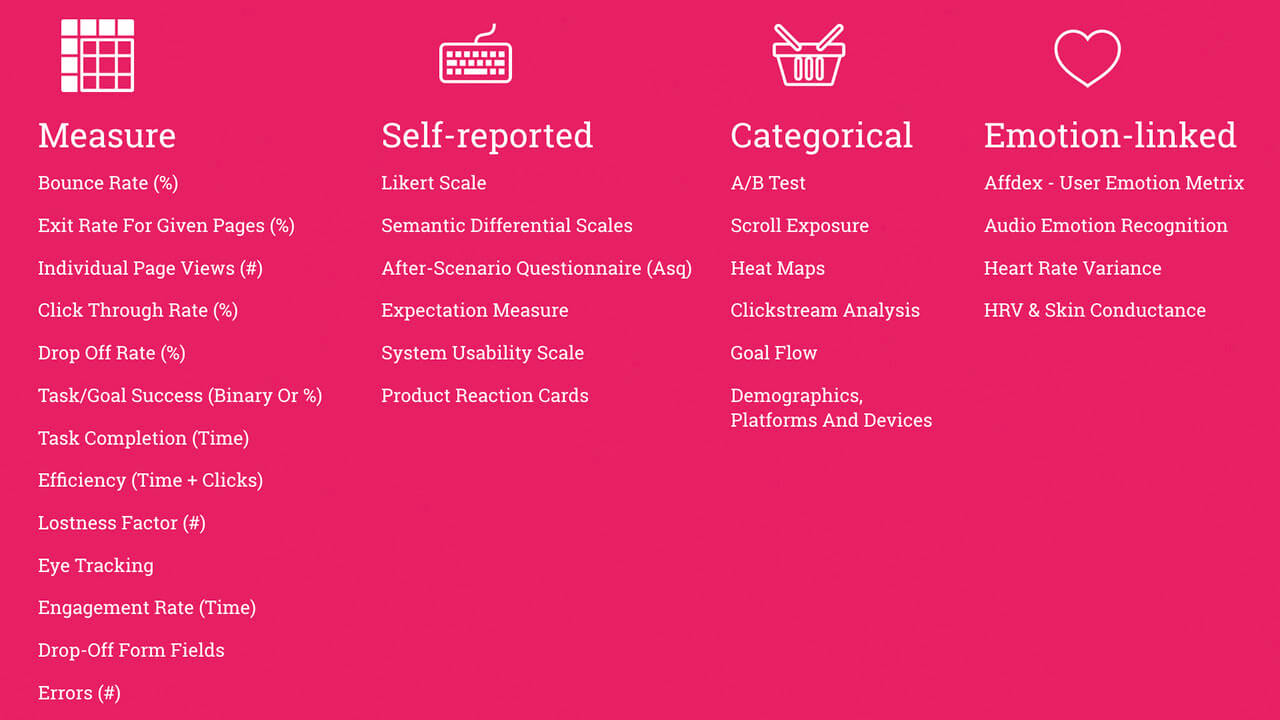
Commonly known UX metrics in four categories
Sometimes it could be a challenge to put the metrics in practice. While working on a client project recently, we applied this thinking to the project in order to estimate the return of good design in monetary value.
As part of the project, we reimagined and redesigned various internal services. One of the key objectives of the project was to look at the existing user journey, try and identify the pain points, as well as try and discover the opportunities for improved experience and so on. Every service goes through the cycle of finding the issues, discovering opportunities, and delivering the optimal experience to the end-users.
In the process, one of the key challenges was that existing inefficiencies in delivering those internal services could go unnoticed quite easily. These are the kind of inefficiencies that are either not easily identified or do not have a robust-enough integrated system to help the team analyze logs and user behavior level data, thus bringing forth the “Who, What, When, Where” level analysis.
To solve that, we designed an experience measurement tool that helps the design and business teams at three levels:
- Measure Financial Return: Measure the impact of good design in terms of its financial value
- Set Design Targets: At the outset of the design cycle, the team could identify targets using the tool. Setting early design targets helps the team in understanding what could be the return if these ‘good design targets’ are achieved.
- Create What-If Scenarios: The tool helps the team in conceiving hypothesis, and in discovering the delta when values associated with selected metrics change to some degree.
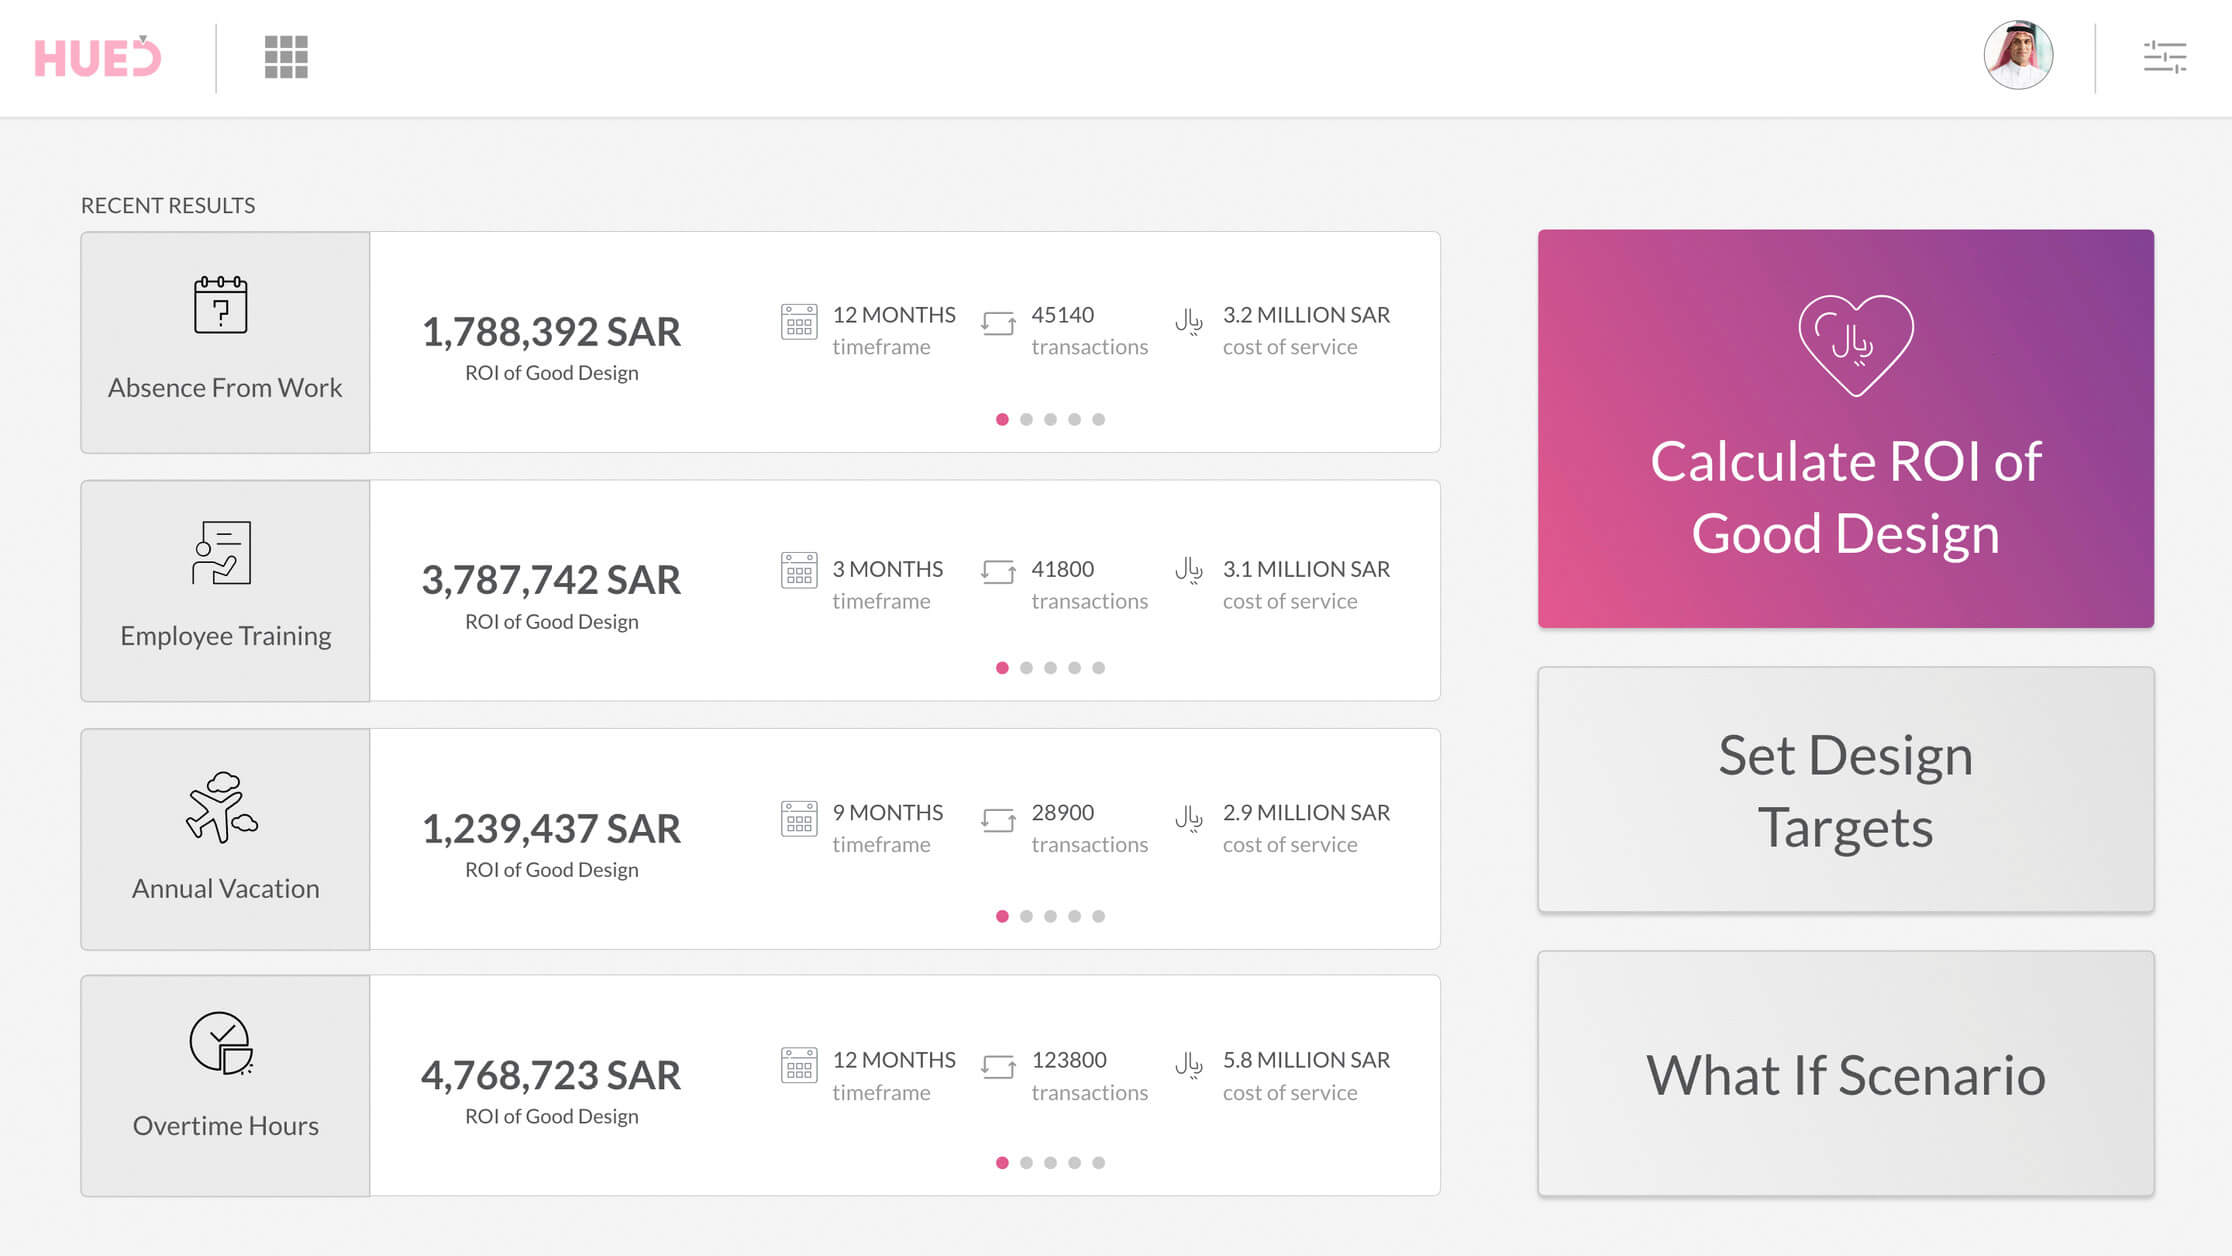
Three use cases of the measurement tool
For each of the above use cases, the design team would typically use the tool in the following ways:
Select services and essential metrics
Selecting service(s) for which the analysis is going to be done is the first step.
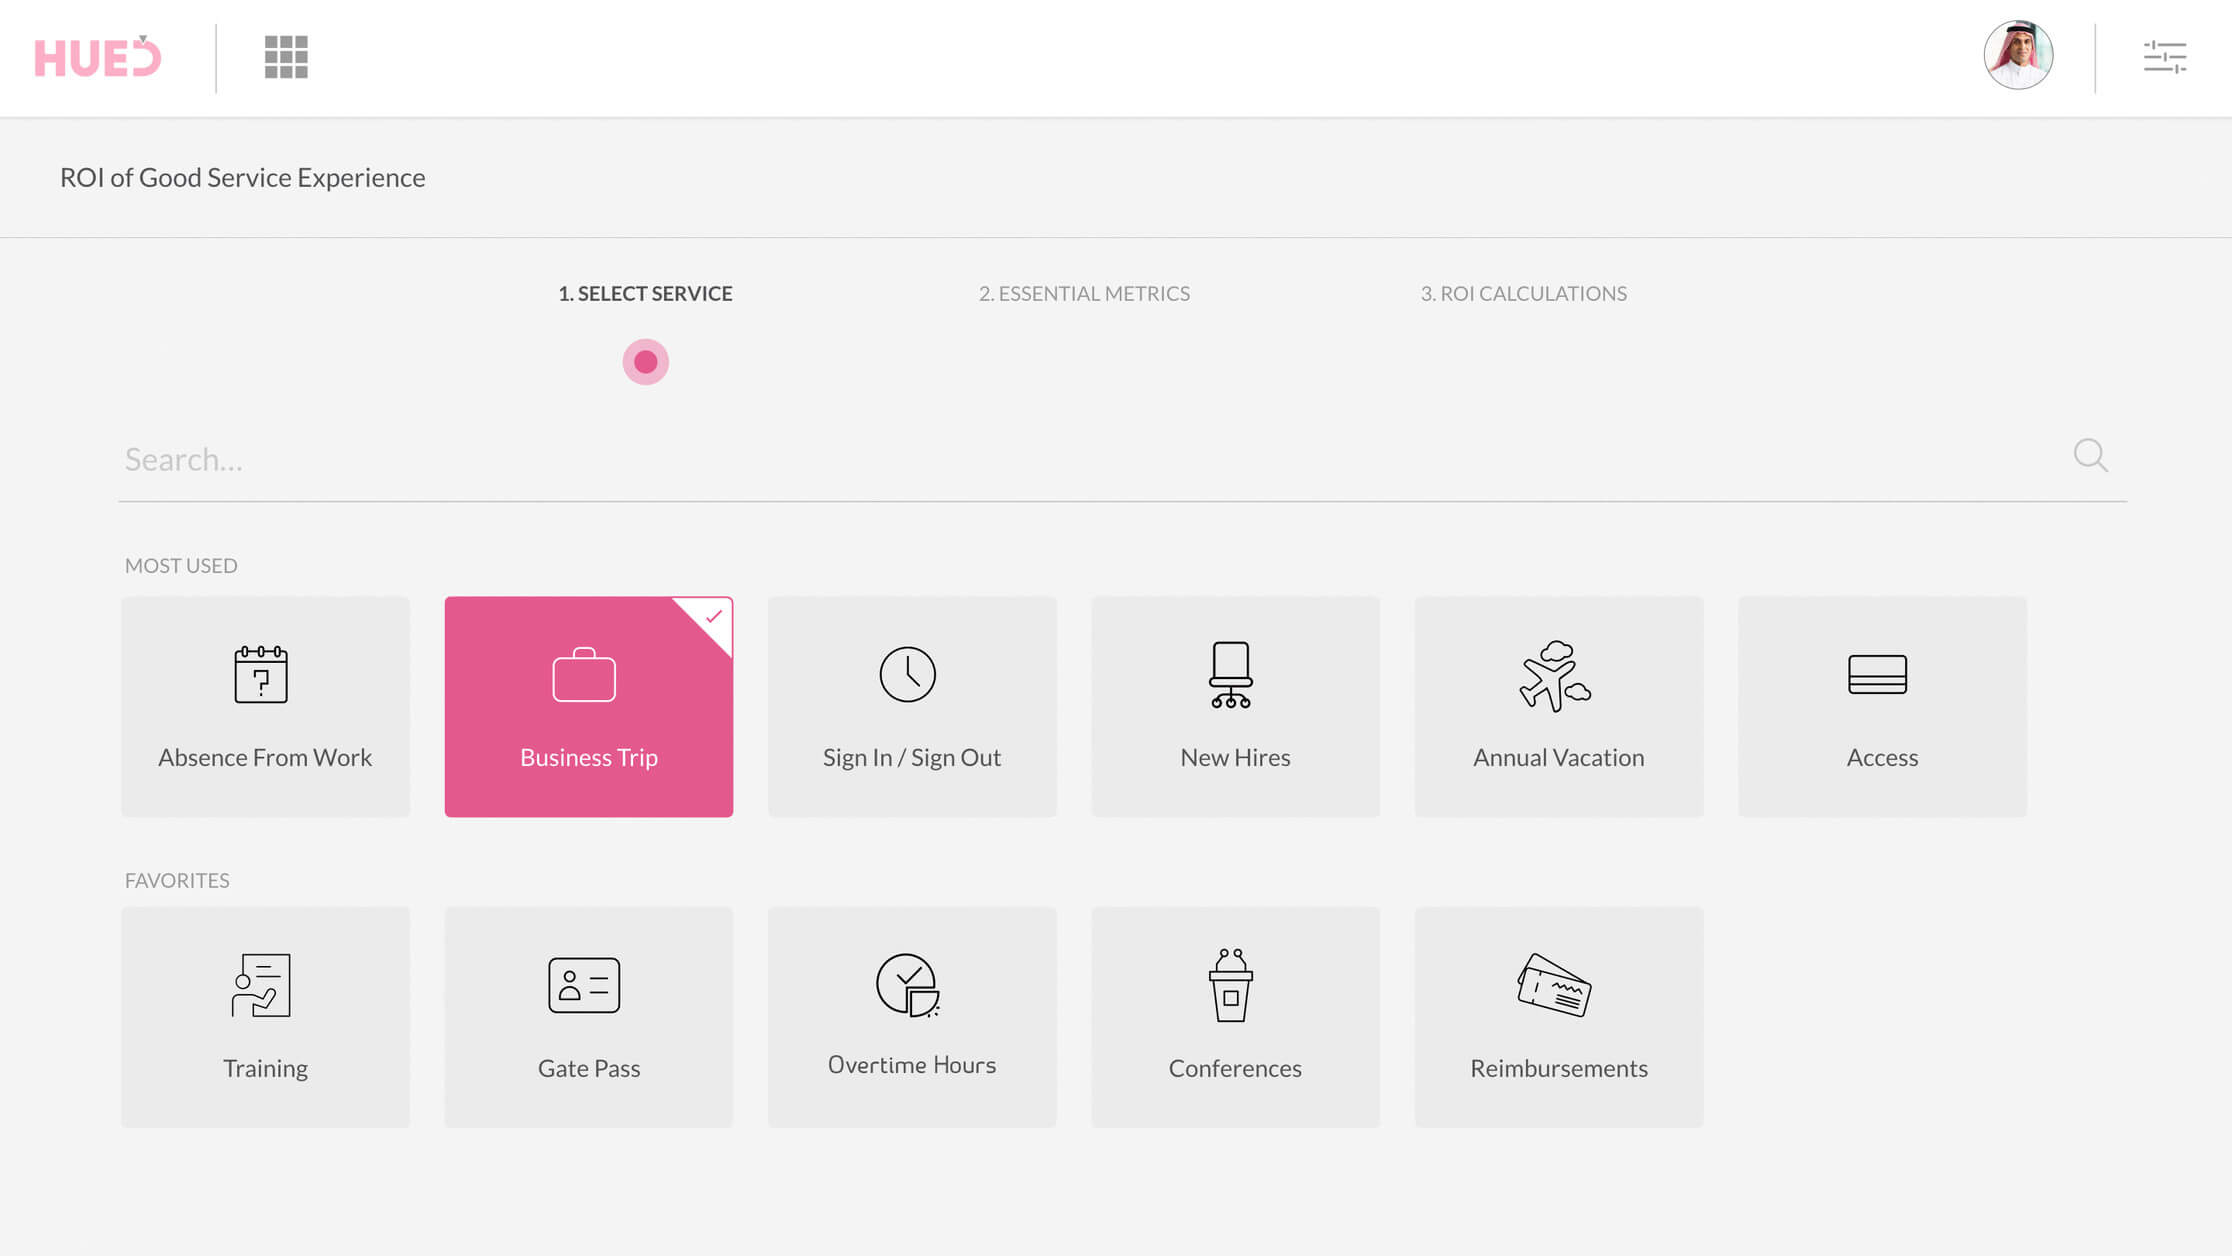
Service selection
After service-level selection comes selecting essential metrics that help in doing core analytical work. Providing values (or pulling from the database) associated with these metrics is a prerequisite for further service-level analytics to be done.
The following are some examples of the essential metrics that the tool uses:
a. User segments and roles
b. Time spent by these user segments and roles in various stages of the service
c. The timeframe for the analysis
d. Number of transactions in the selected timeframe
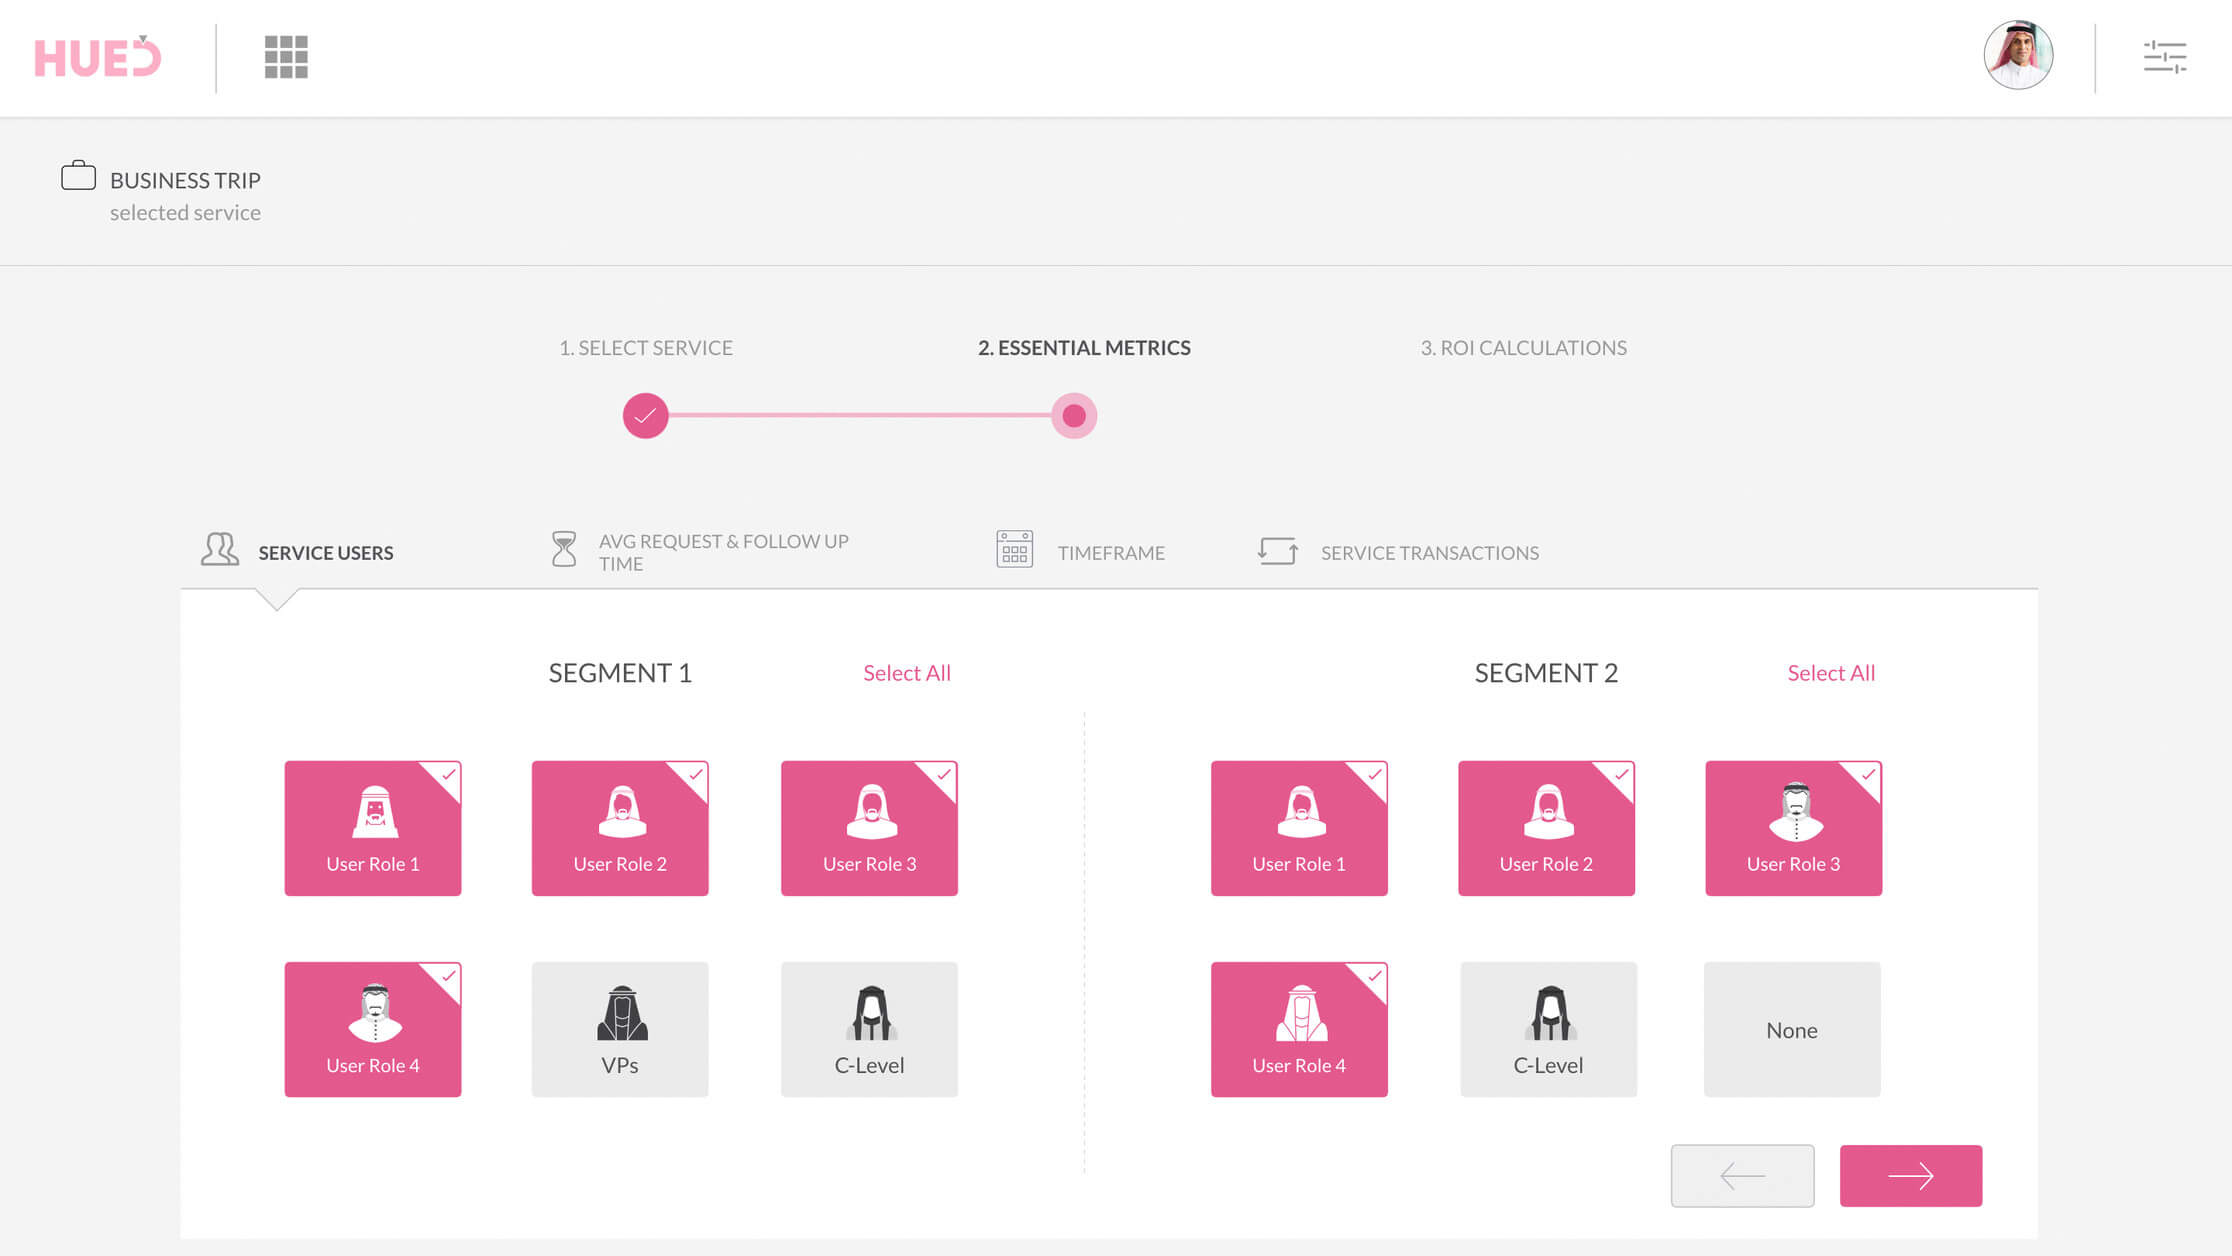
Essential metrics selection and value configuration
Some (or most) of these values can be pulled from the database if a basic analytical system is in place.
Service level analysis
The selection of services and essential metrics feed needed data into the next step, which is about analyzing service level metrics.
Following are six service level metrics that are described further in the article:
- Service Request Optimization (SRO)
- Service Closure Efficiency (SCE)
- Cost of Delay and Escalations (CoDE)
- Service Support Efficiency (SSE)
- Rejection and Resubmission (RR)
- Drop off avoidance (DoA)
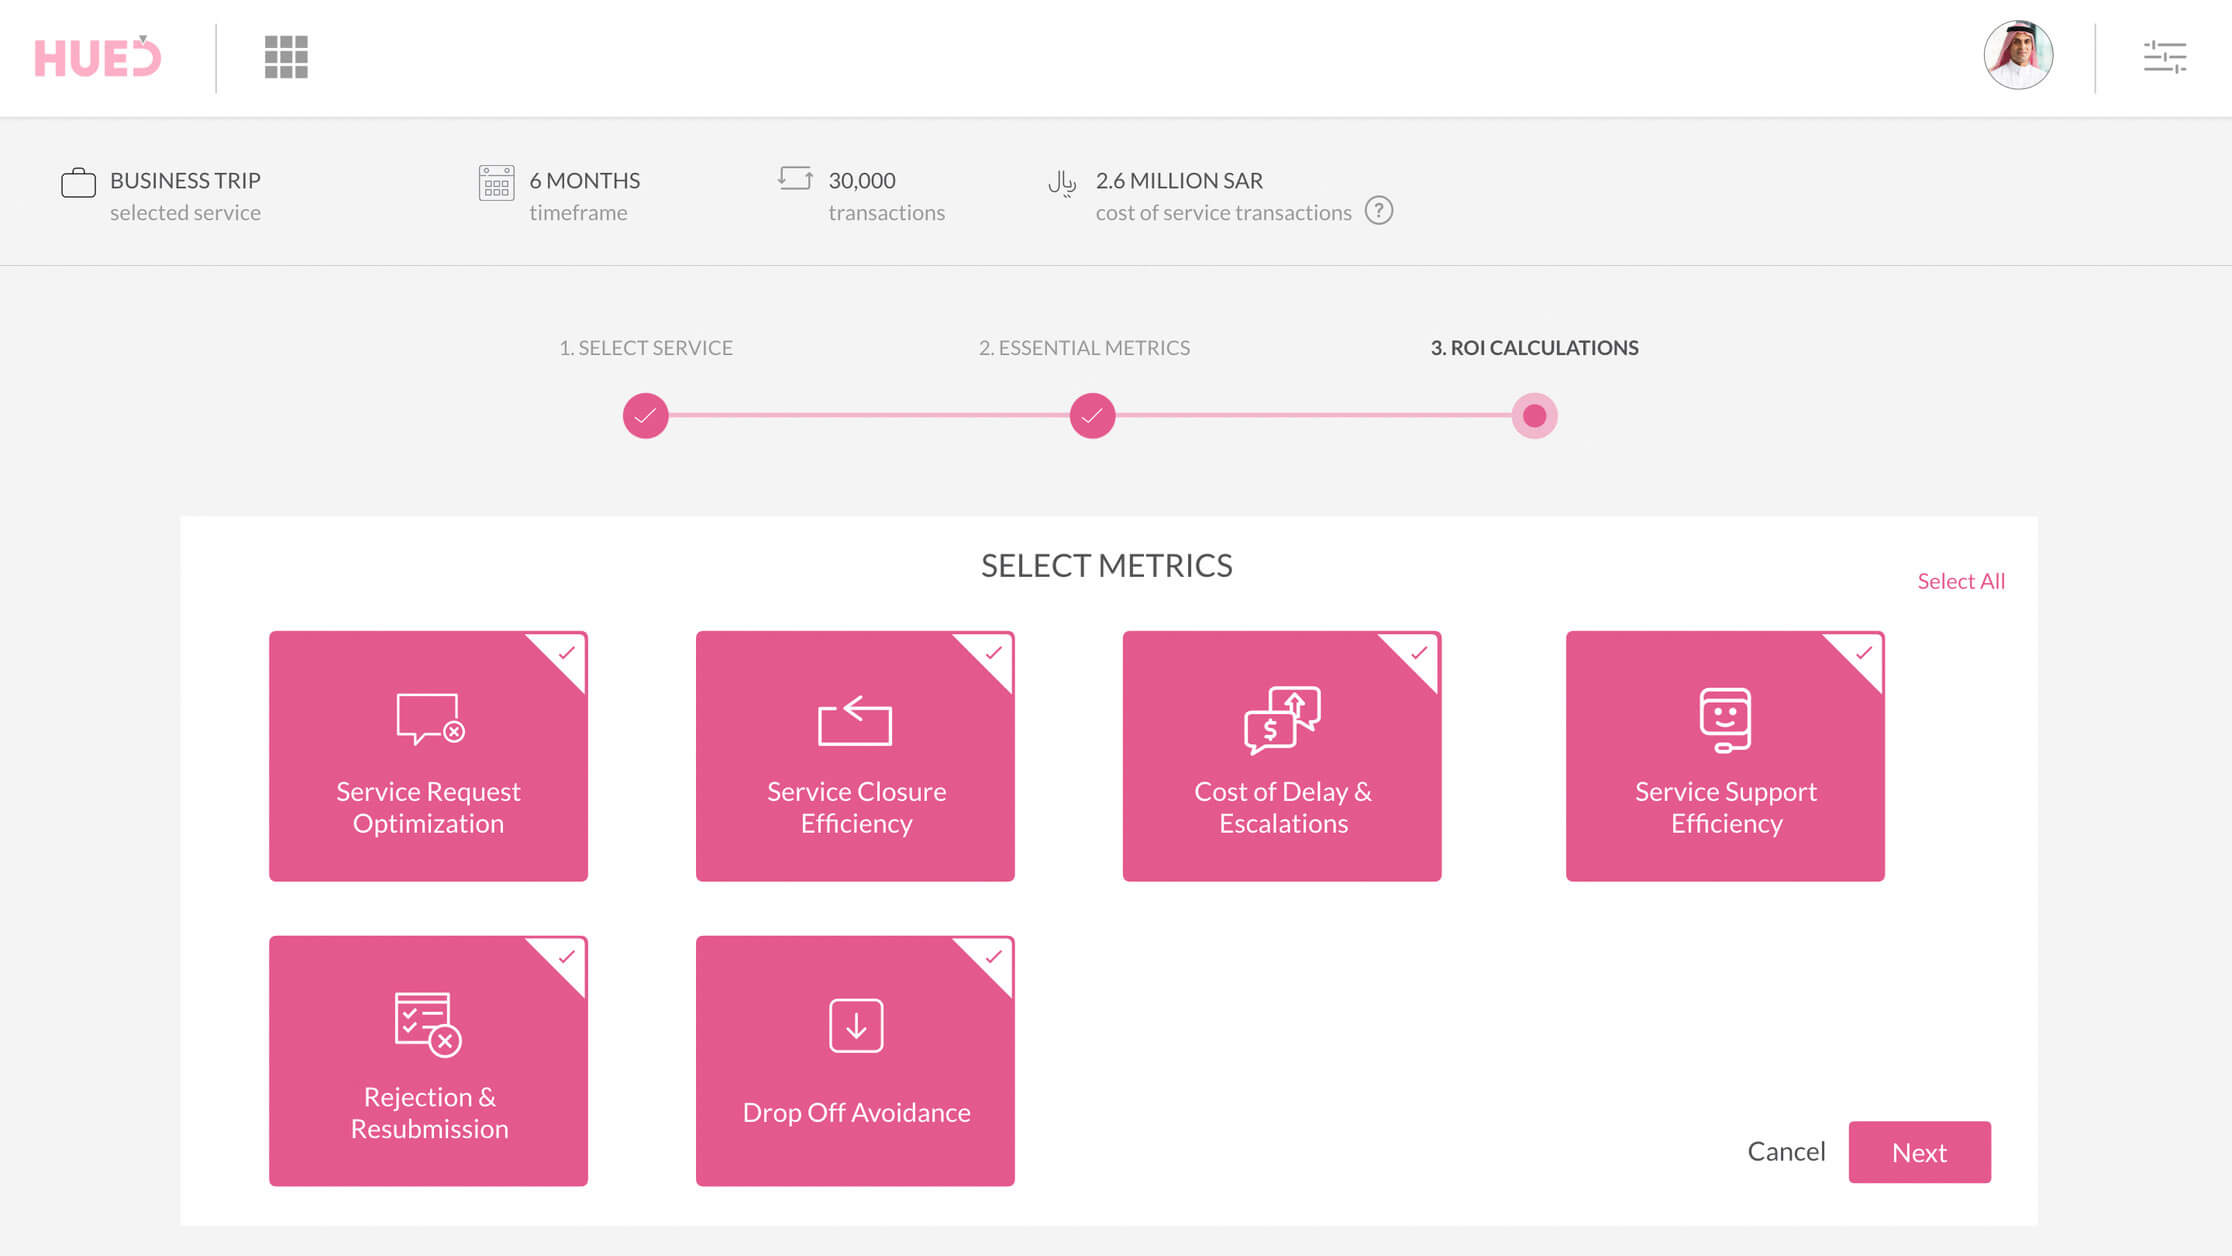
Six service level metrics
Let’s understand the application of each of these metrics in detail:
1 – Service Request Optimization (SRO) — Helps in measuring whether the request by the service user is needed and if there are design opportunities to eliminate the need for the service request in some use cases.
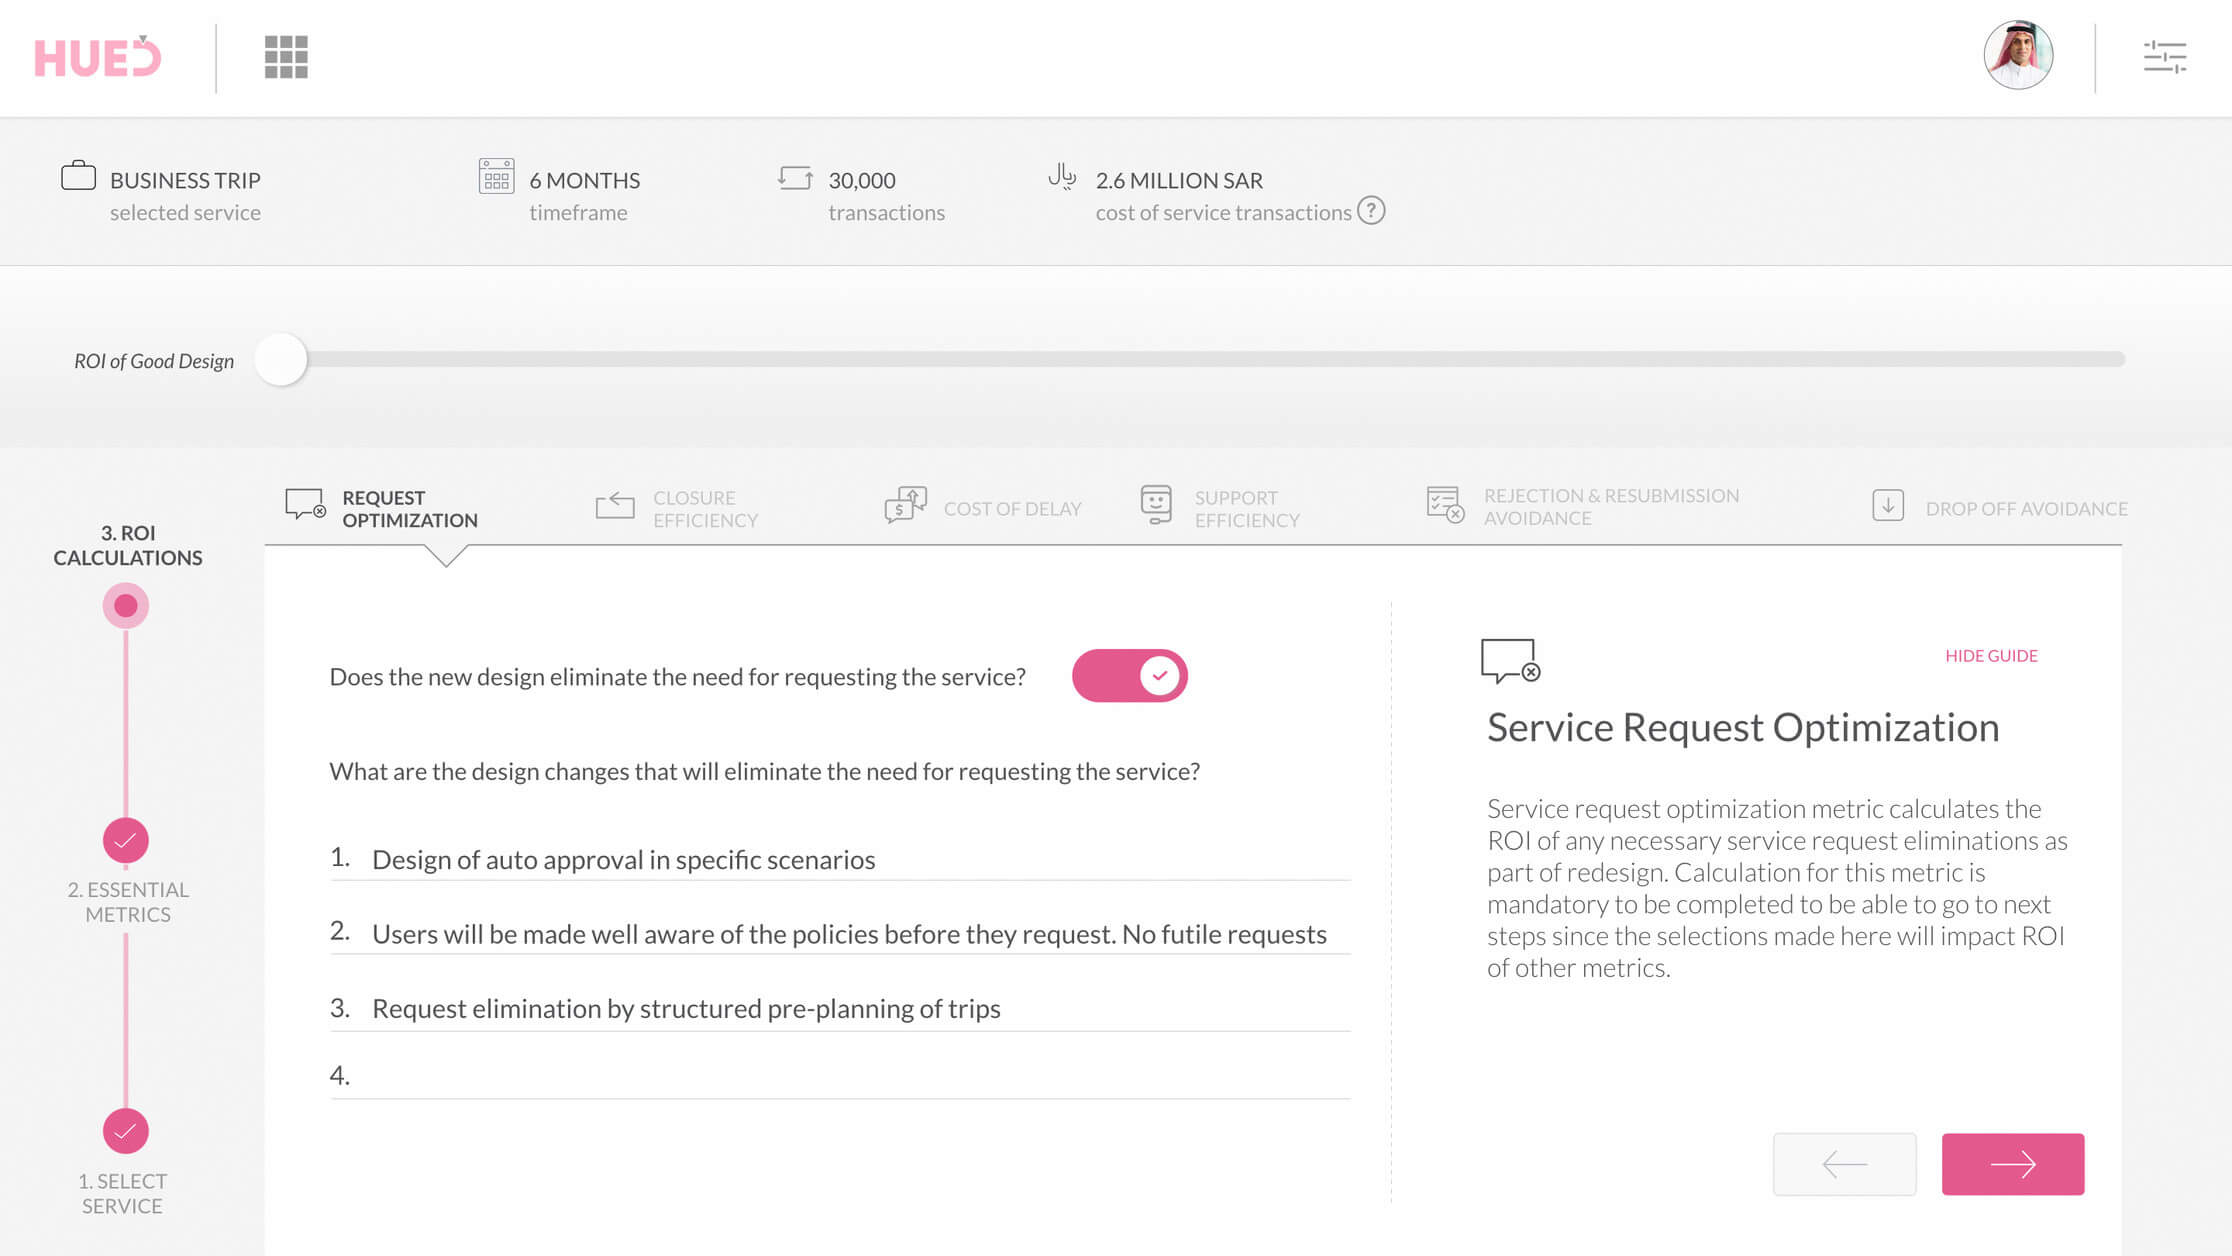
Service Request Optimization Analysis
SRO analysis helps in estimating the return of any necessary service request elimination as part of the redesign. The calculation of this metric is mandatory to complete to be able to go to the next metric. It has to be pre-selected for the user. Selections made here will impact the analysis of other metrics.
In SRO analytics, the user of the tool would typically answer questions such as:
i. Whether new design eliminates the need for requesting the service?
ii. What are the design changes that eliminate the need?
iii. What is the % of service requests that will be eliminated as a result of the redesign?
2 – Service Closure Efficiency (SCE) — How can design help in reducing the time it takes for the service to be delivered? SCE is applicable when the redesign of the service reduces the time it takes in requesting, approvals, follow-ups, and general processing of service in various stages.
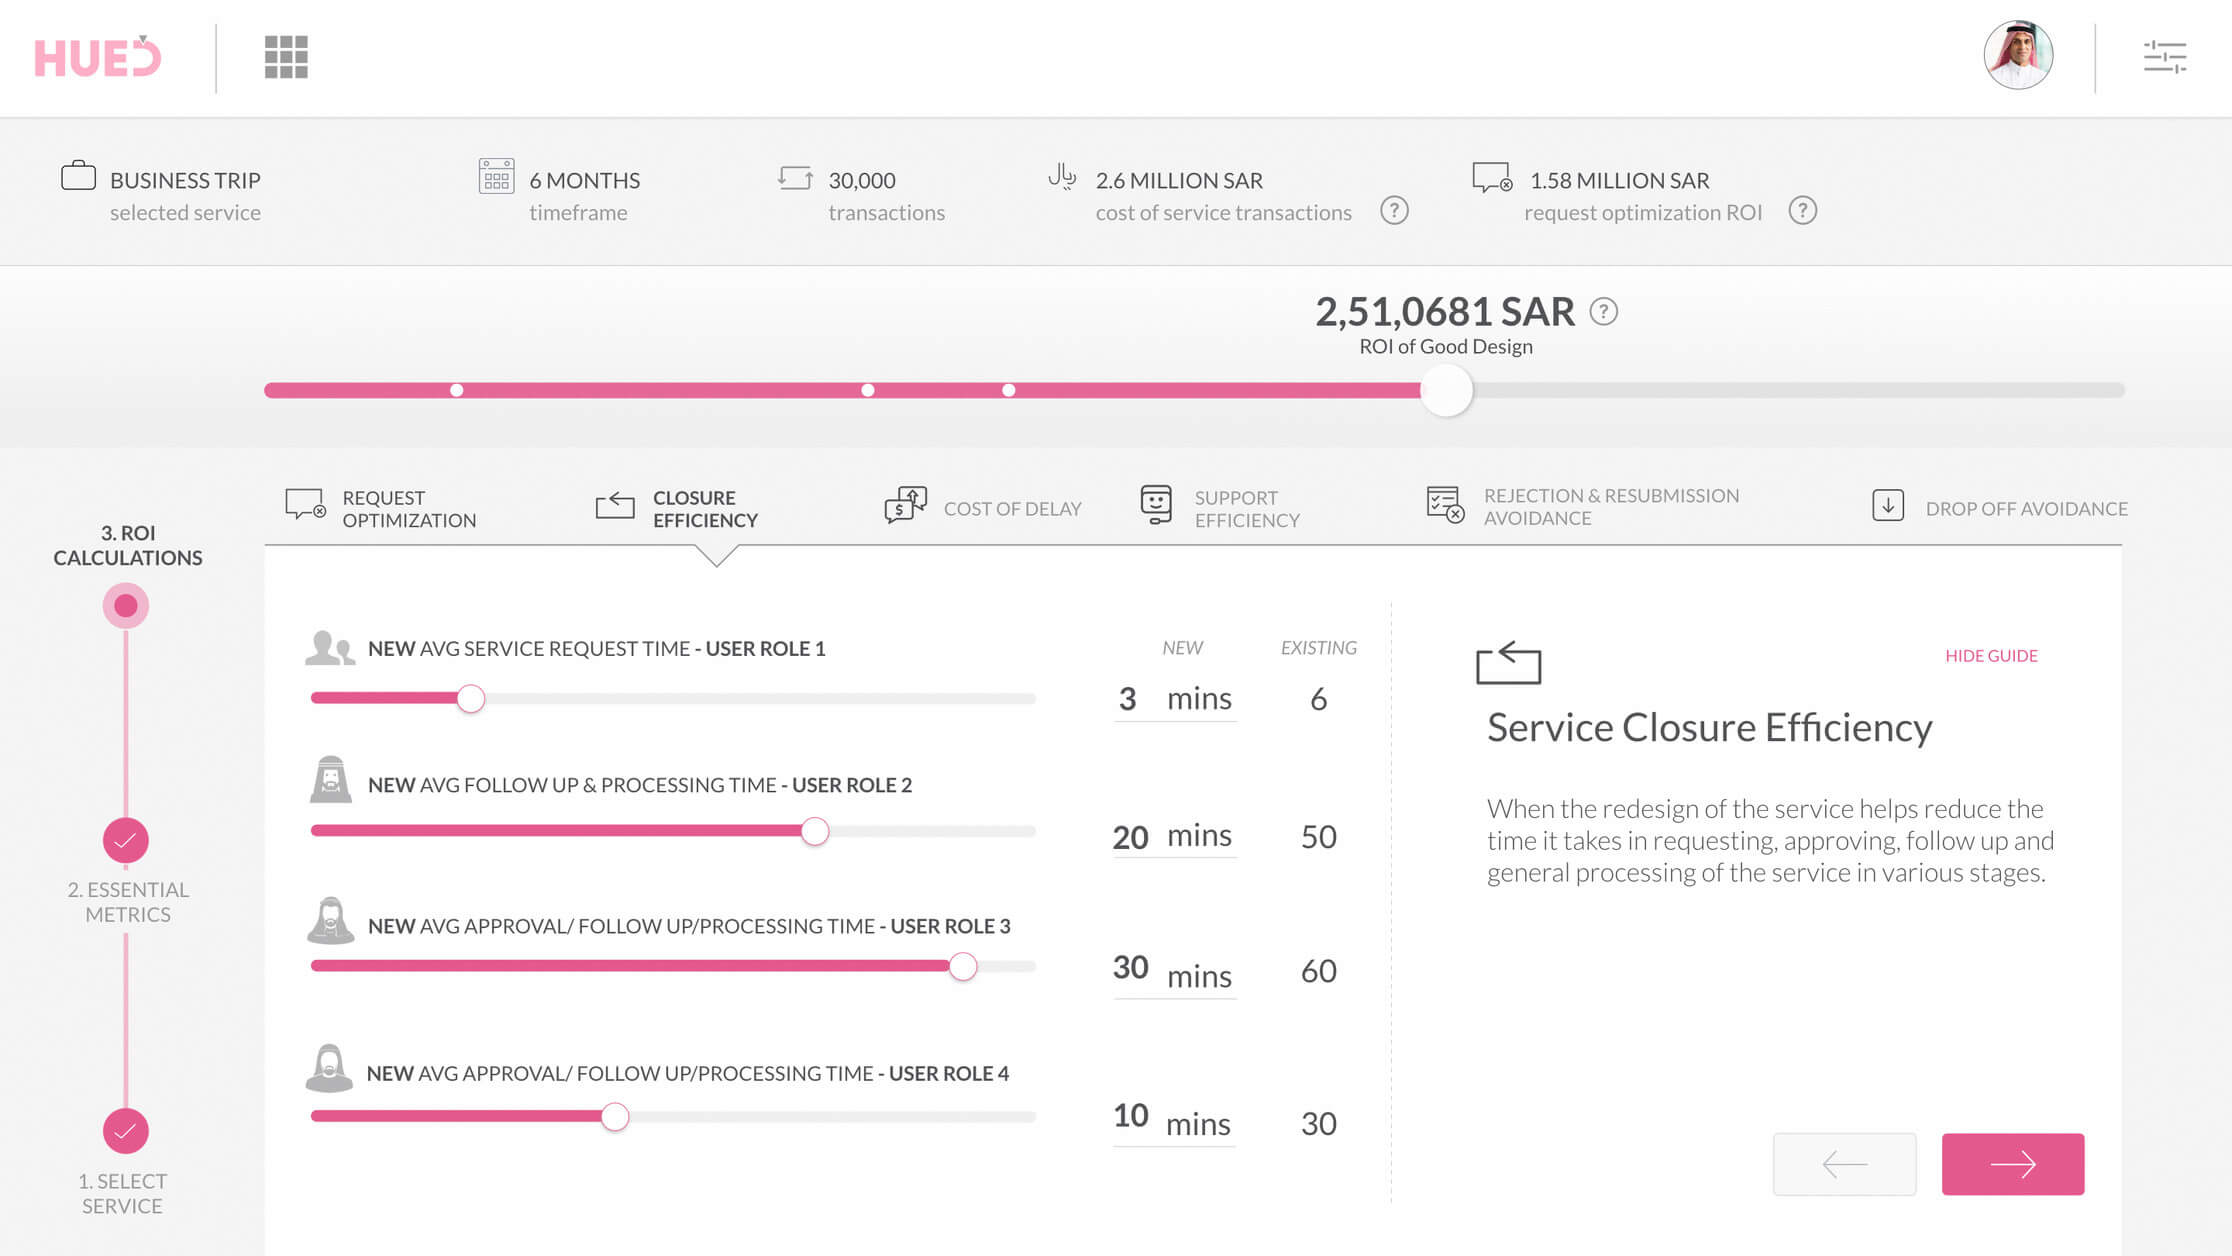
Service Closure Efficiency Analysis
3 – Cost of Delay and Escalations (CoDE) — The estimated return here is calculated by two factors:
i. Any delays and escalations avoided as a result of the redesign
ii. Reducing the time it takes to attend the delay and escalations
The analysis starts by answering a simple question:
“Would it cost the company to delay or escalate the processing of the service?”
If the answer to the question is ‘yes,’ specifying the number of times the service was delayed during preselected time frame is needed.
Another key question to answer here is:
“What were the top causes behind the delay and escalations?” And how would redesign help in eliminating some (or all) of these causes?
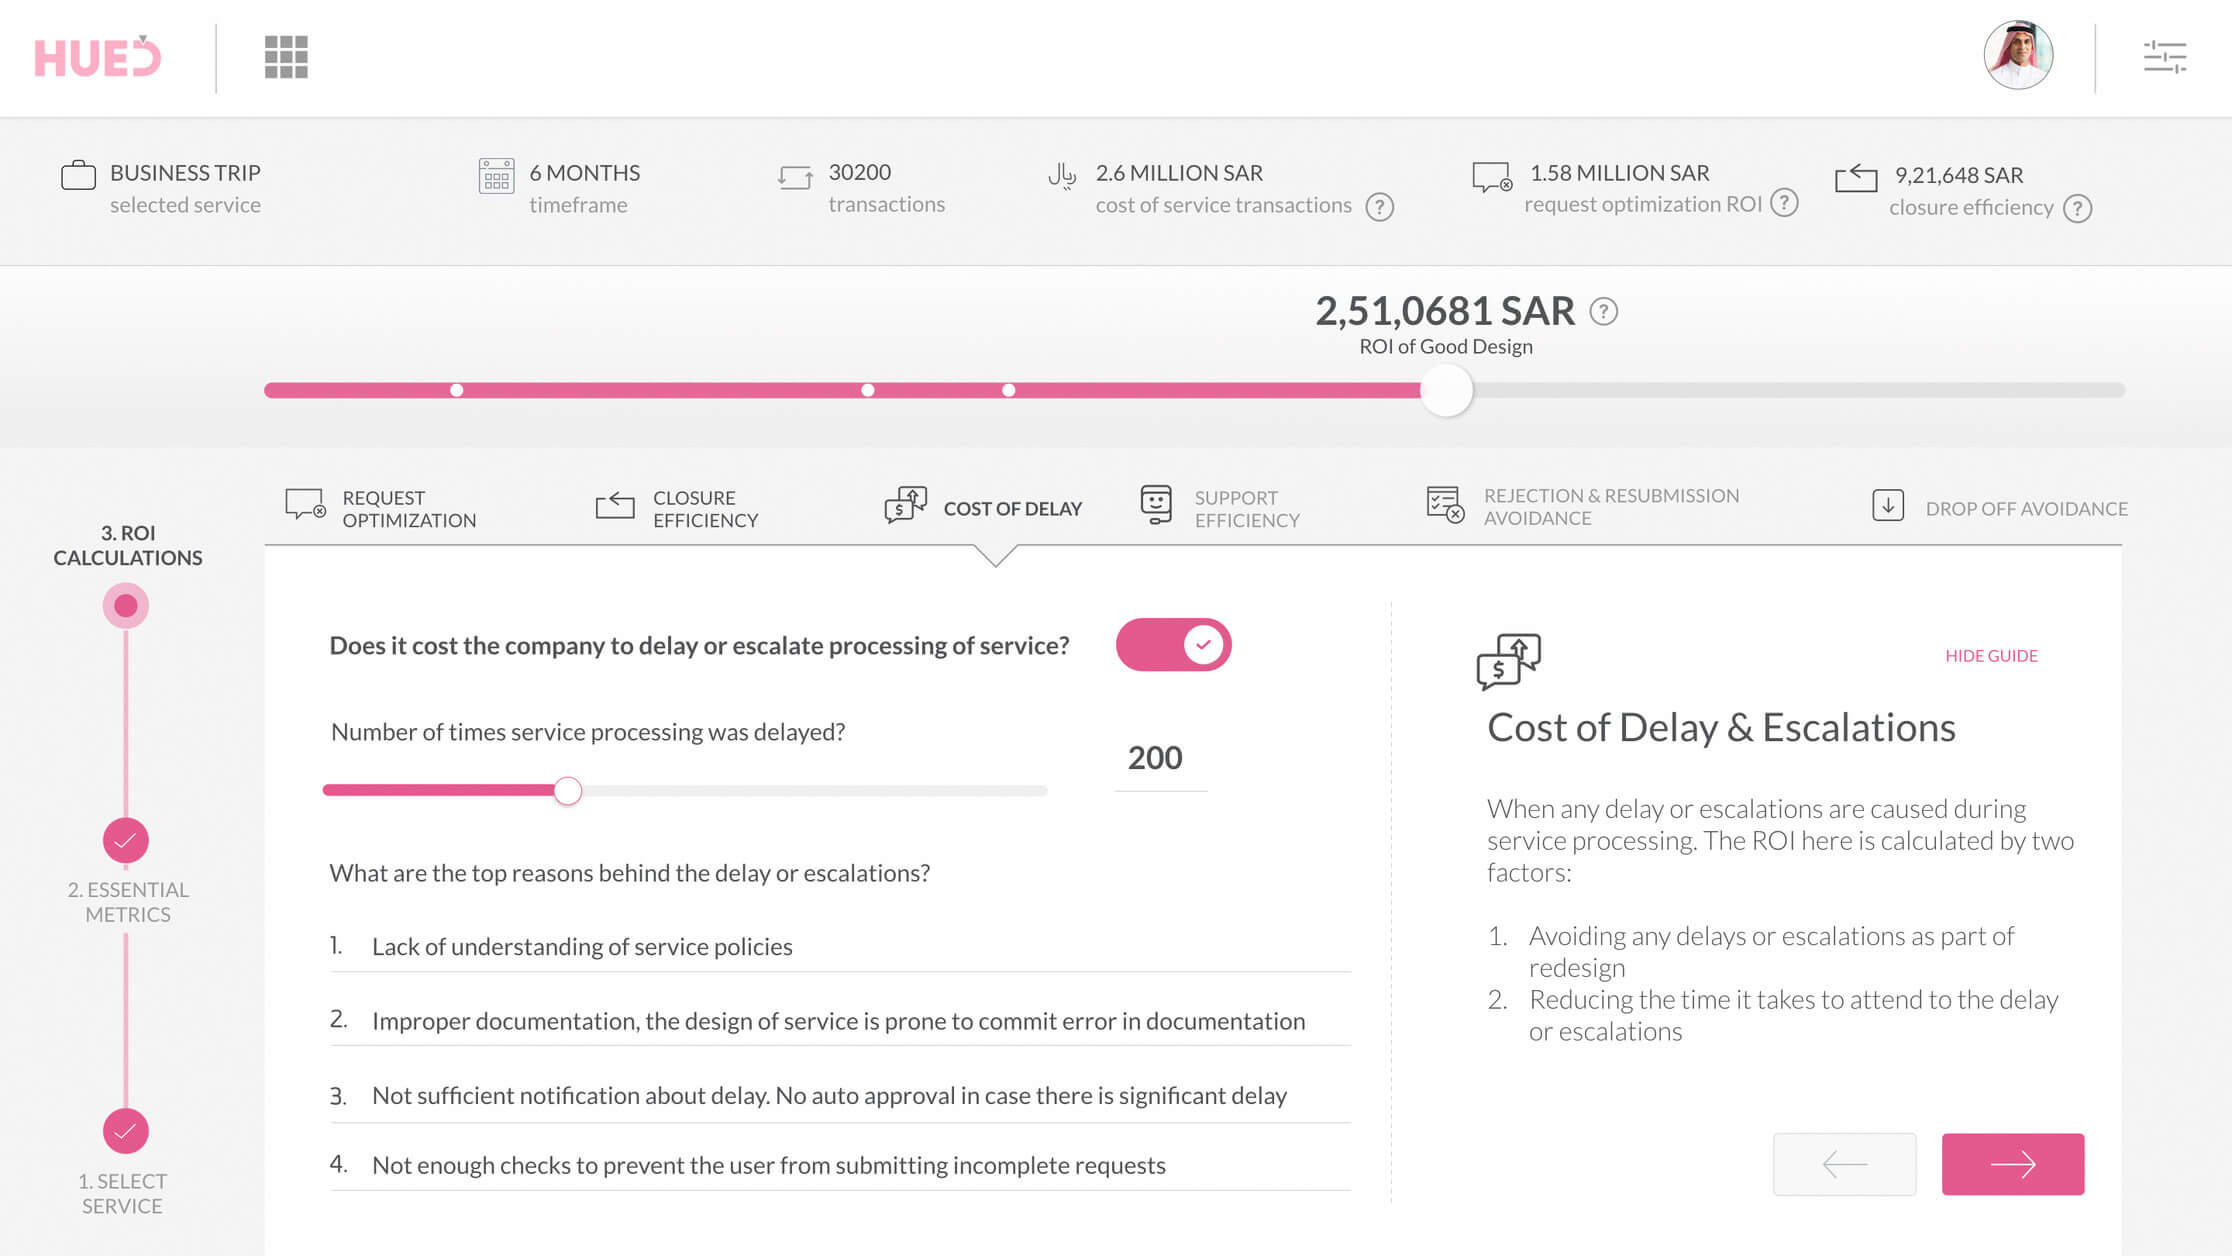
Cost of Delay and Escalations Analysis
4 – Service Support Efficiency (SSE) — Every support ticket bears some cost to the company. How can design help in optimizing the need for support? We understand that one of the principal targets of any design project is to optimize the cost of support as much as possible.
The analysis starts with identifying top issues that cause a majority of service tickets (for example, Lack of understanding of service policies among the users). Then comes specifying the causes fixed as part of redesign and % of support tickets that could be eliminated as a result of the redesign.
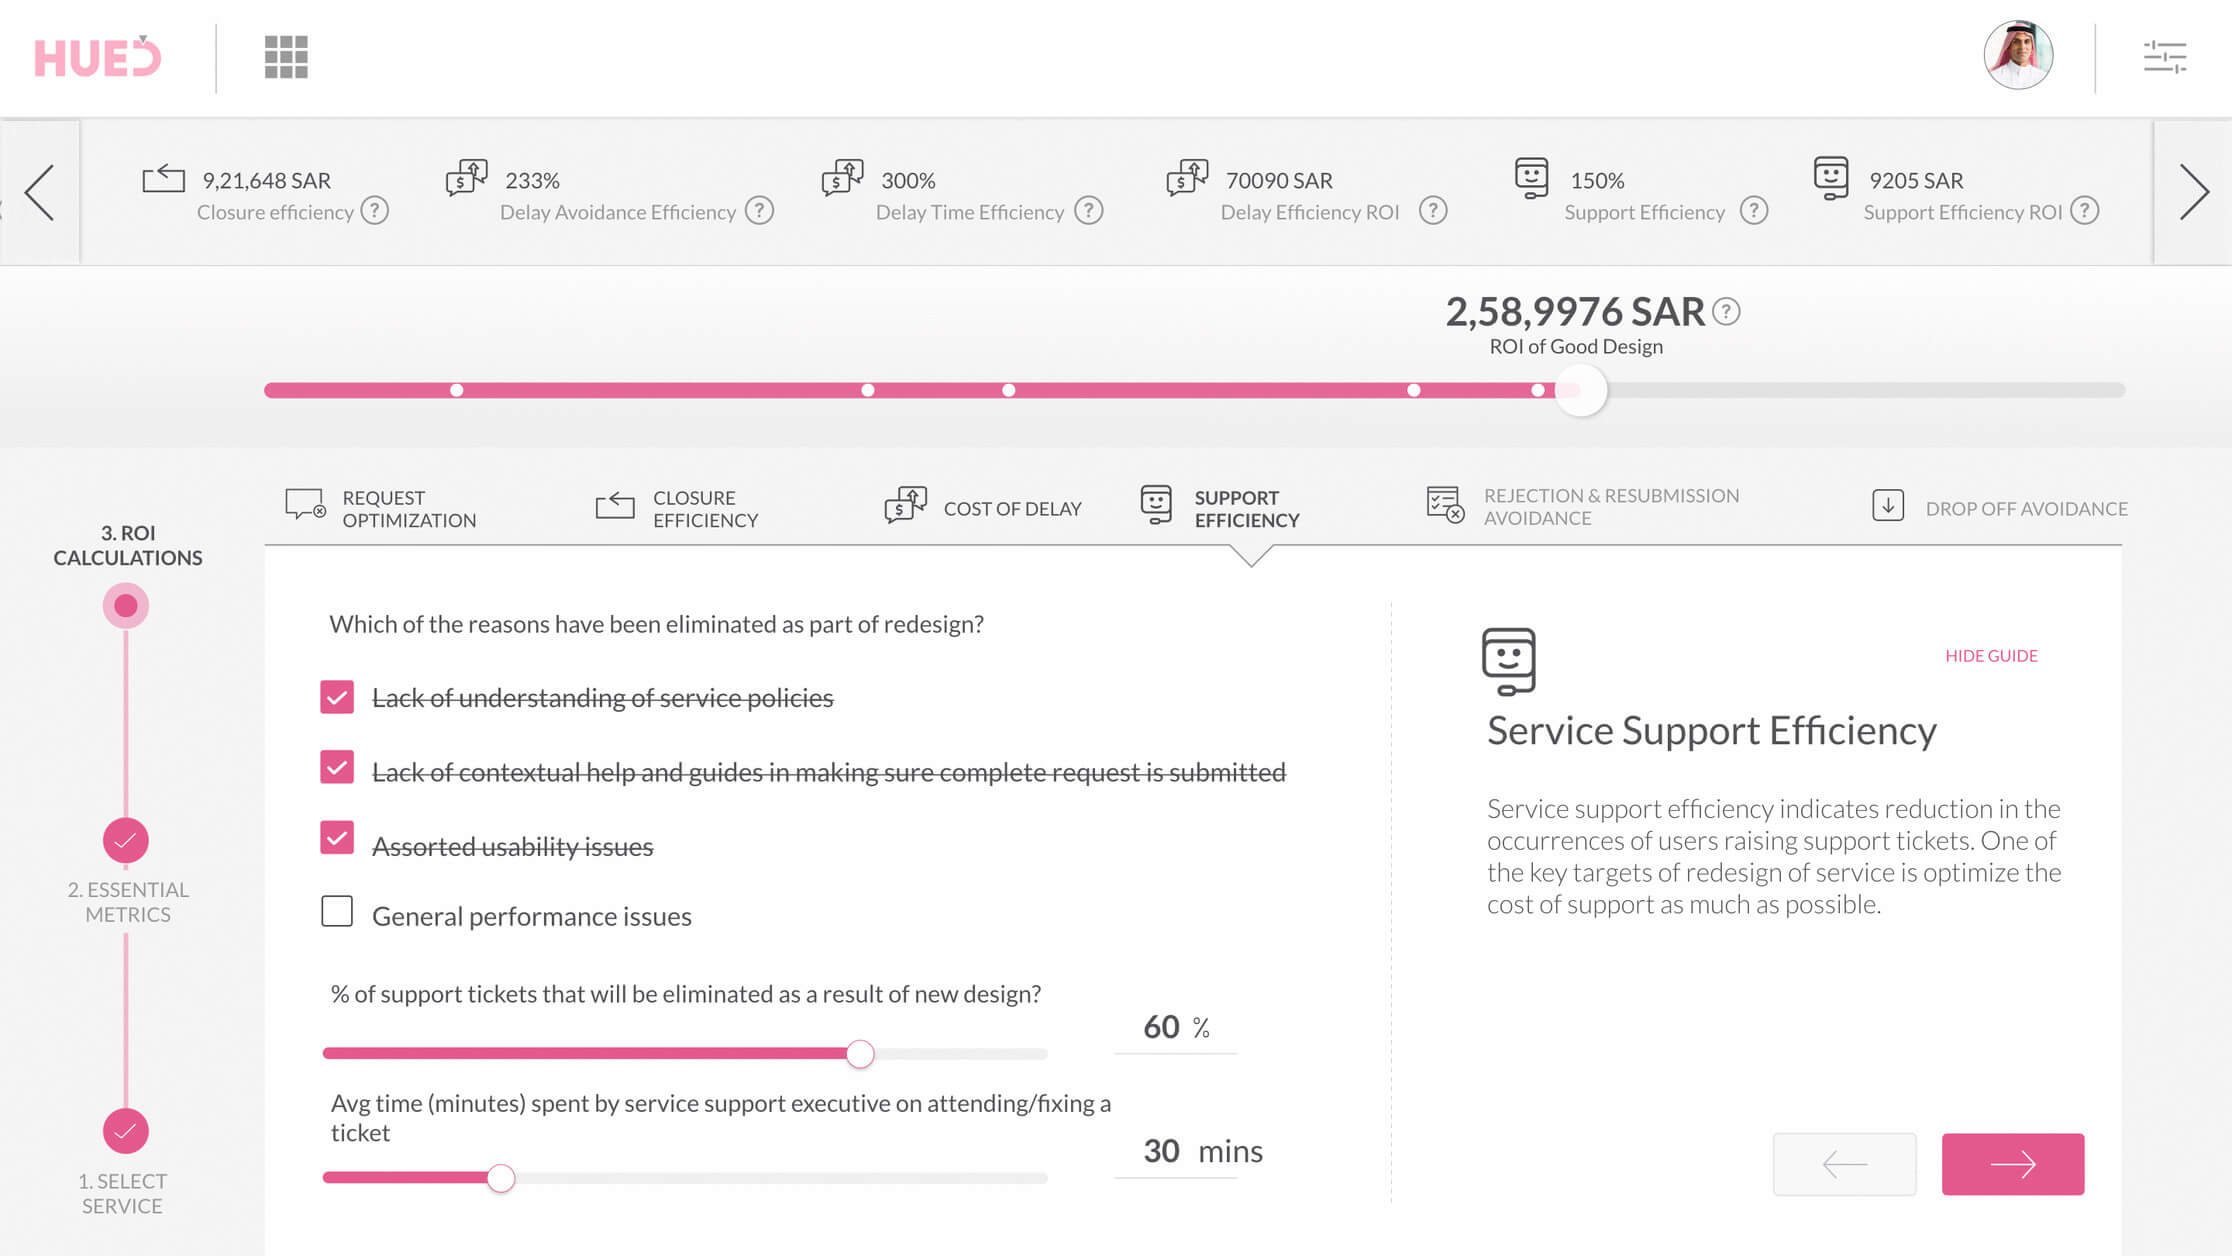
Service Support Efficiency Analysis
5 – Rejection and Resubmission (RR) — The design goal here is to reduce the occurrence of rejection and resubmission.
The analysis starts with answering questions such as:
i. The number of occurrences in the past in all user roles
ii. Average time spent on each rejection
iii. Top reasons behind and what gets fixed as a result of the redesign.
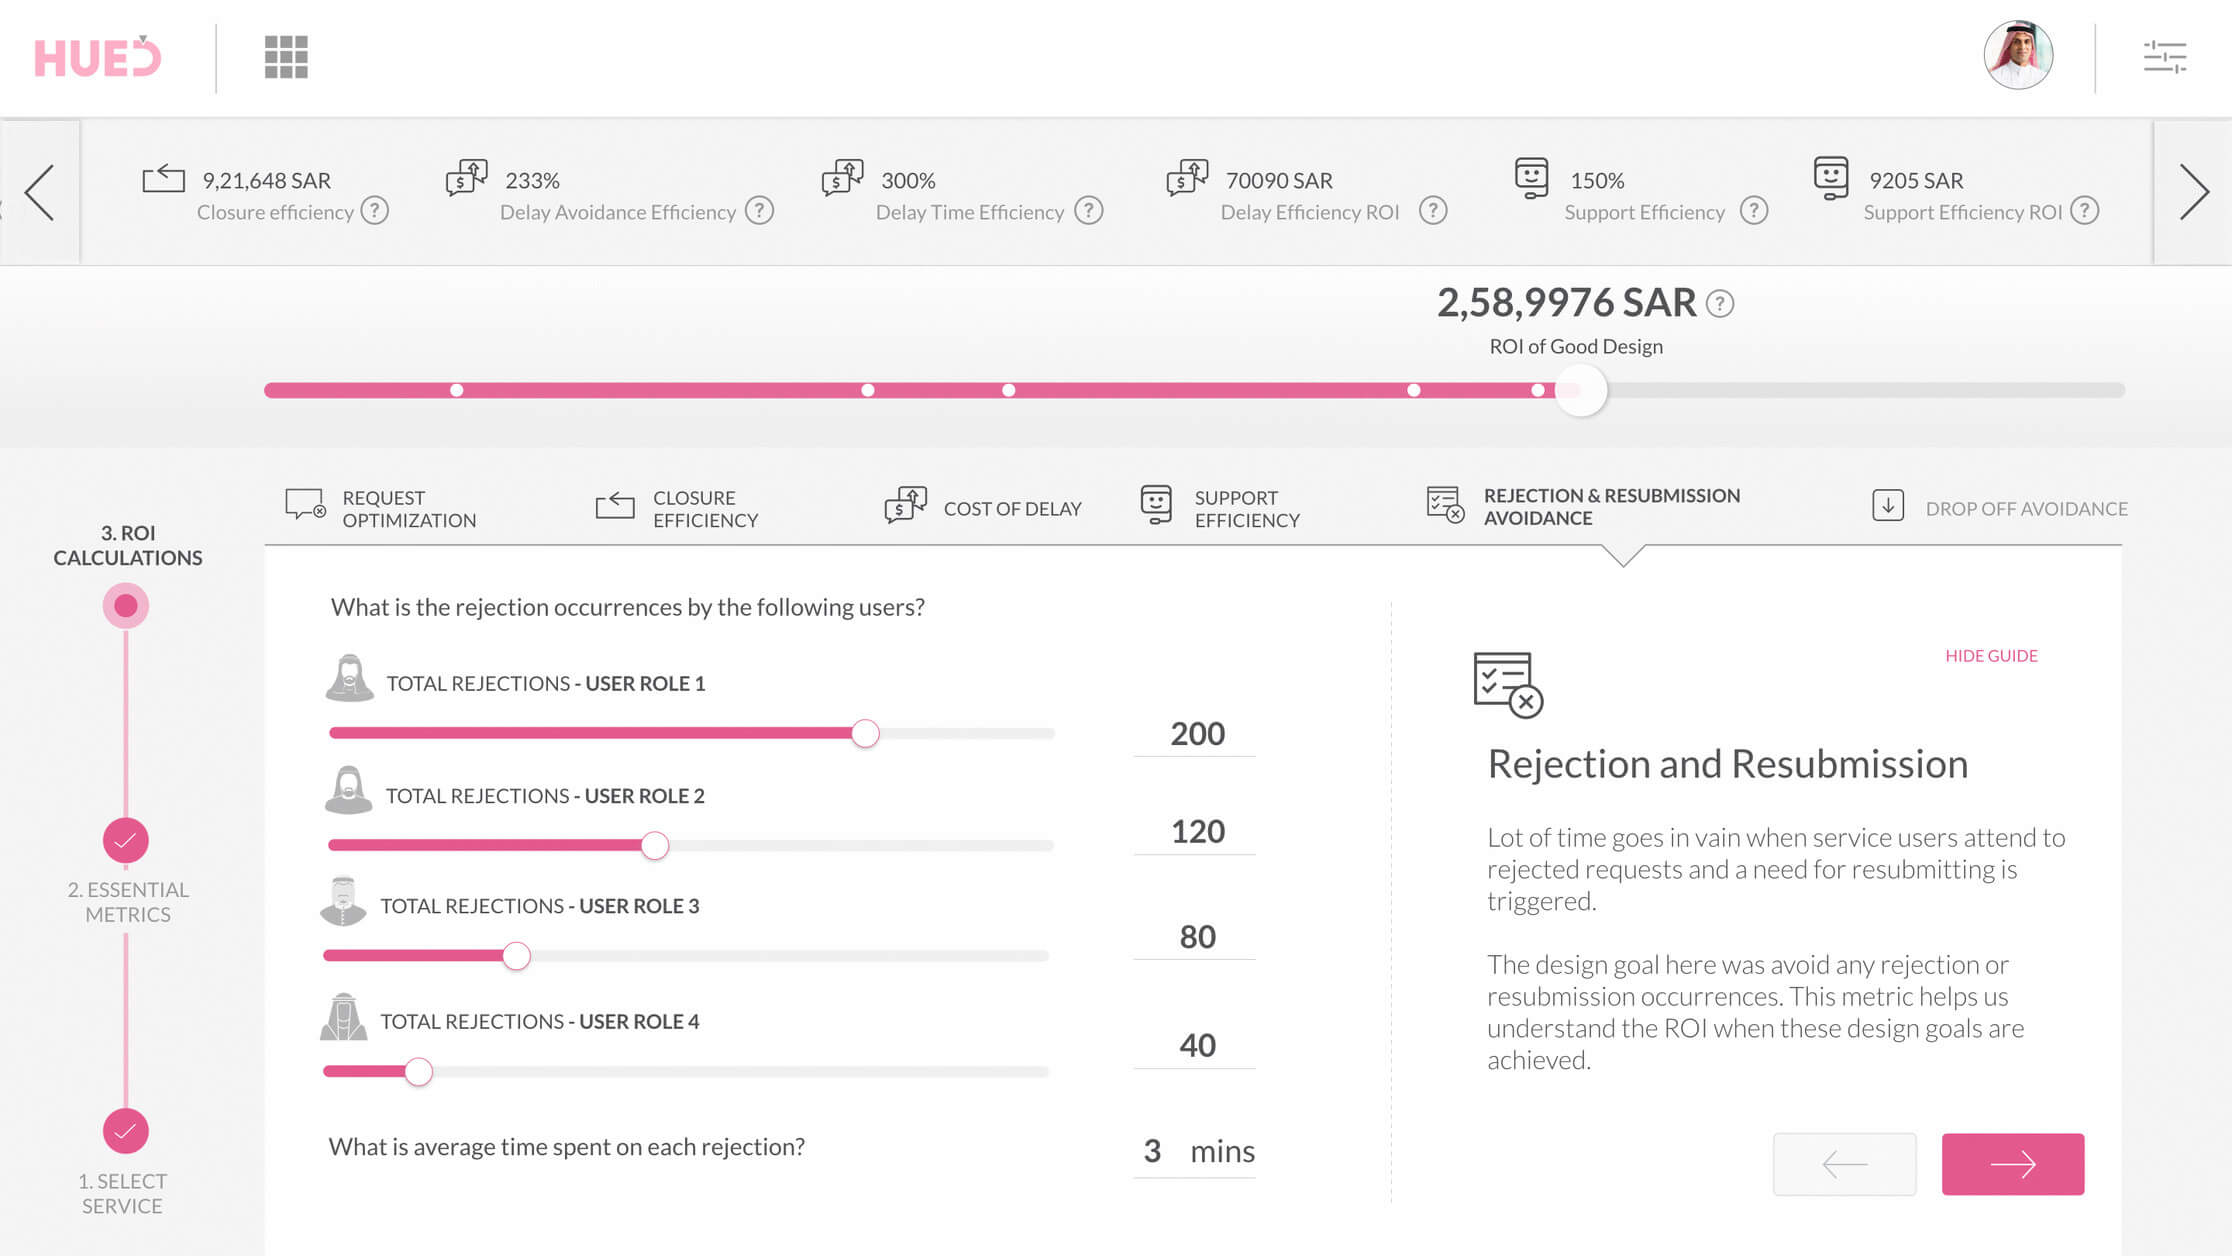
Rejection and Resubmission Analysis
6 – Drop off avoidance (DoA) — The key target here is to eliminate the occurrence of drop-offs that may take place in different stages of interaction. The redesign will tend to eliminate some of the causes behind drop-offs.
DoA analysis needs following the input:
i. Occurrence of drop-offs in different stages
ii. Avg session time elapsed before drop-off occurrences
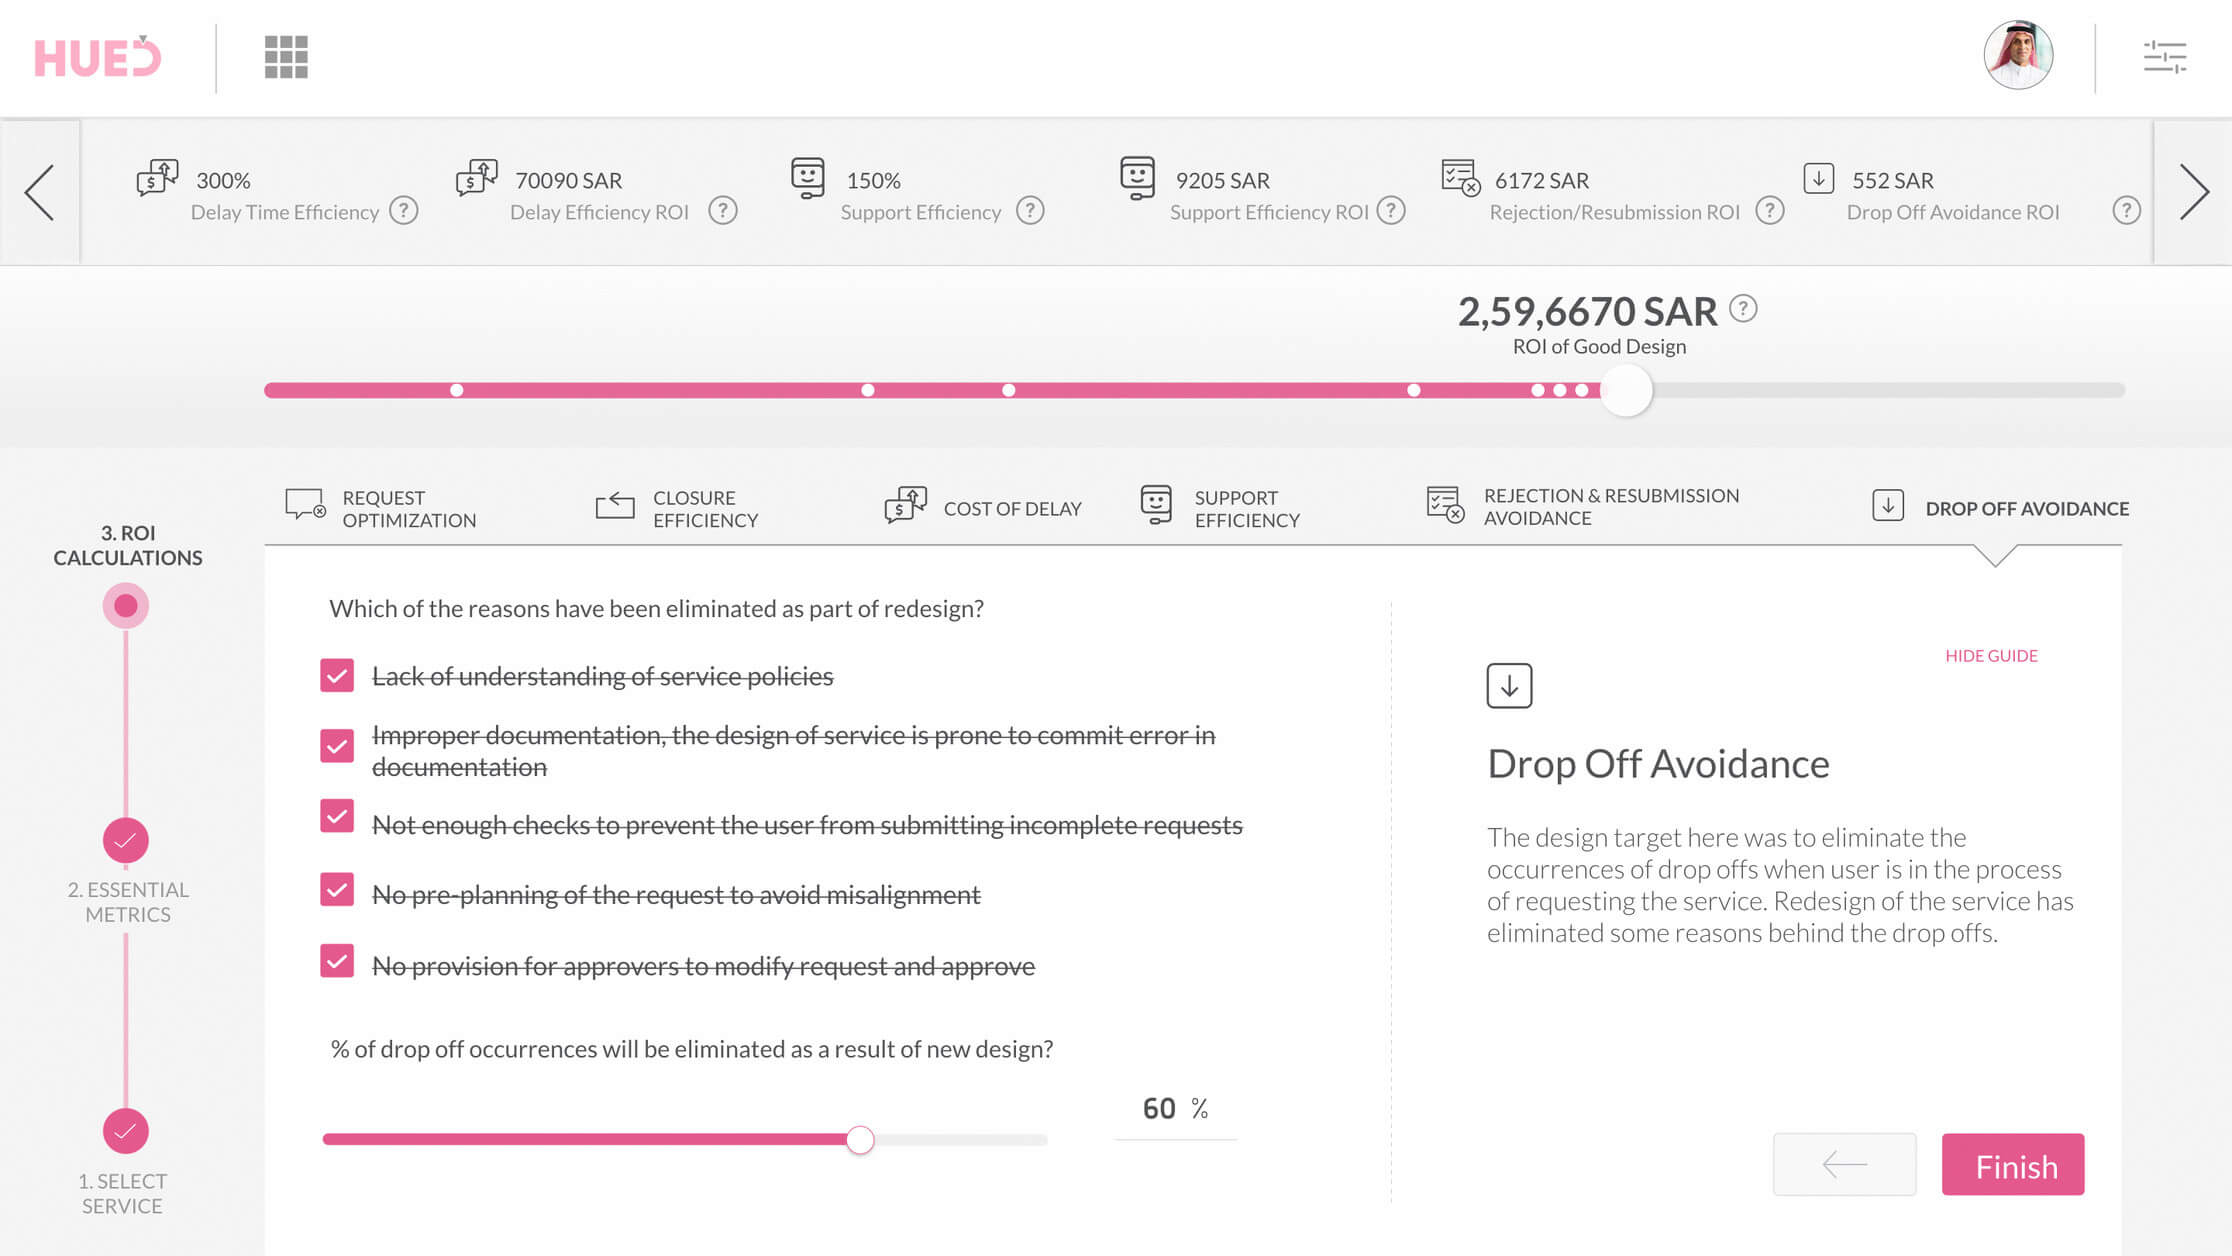
After completing six ‘service level metric’ analysis, we get the final monetary value indicating the return of good design. The analysis helps not just in achieving greater user satisfaction but also in proving the value of good design to C-level executives in organizations wherein design is still being seen as a cost-center.